After another exciting season of football, we thought of exploring how watching the games affects our users. While exploring how many steps users were losing during football games (turns out it was 1700 steps per game!) we found characteristic patterns of cities watching football games. We could see dips in steps as the games came on, briefly rise and fall during halftime, and rapidly shoot back up as the game ended. This led us to wonder what this would look like for the biggest game of the year.
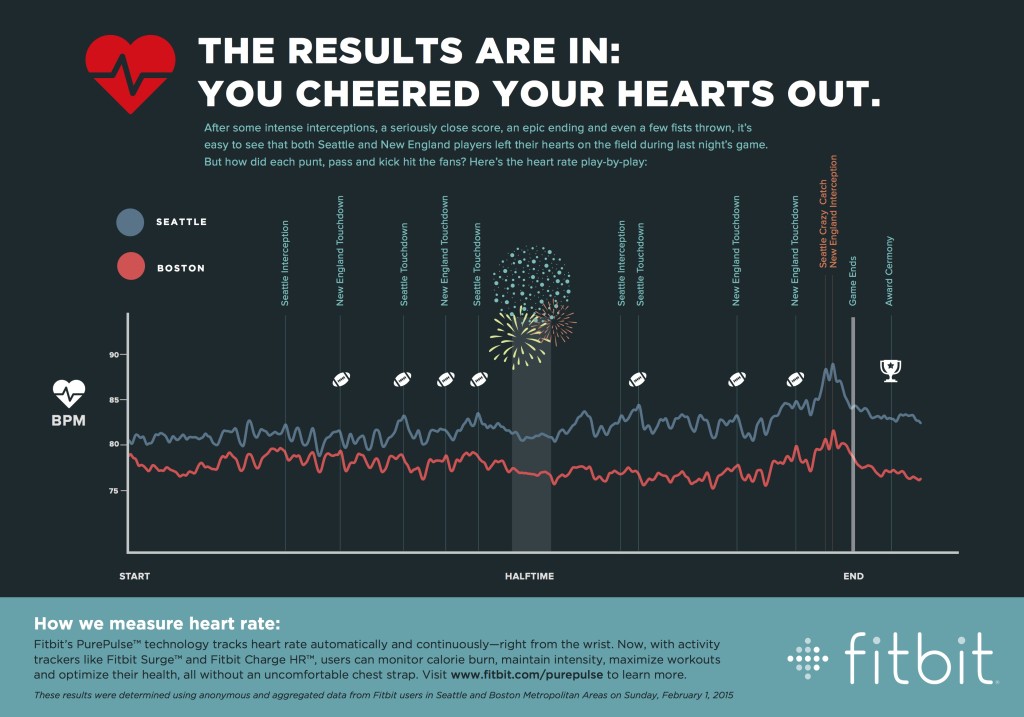
While tracking heart rate throughout the day using anonymized data from each city, we could see heart rates going up for exciting moments during the game! The largest peak for the exciting game ending equates to a rise of about 10 BPM on average for both cities. We also noticed that the overall heart rate for both cities was up by about 3 BPM compared to a non-football Sunday, showing that the excitement was actually felt all throughout the game – although the second half was decidedly more exciting than the first, since that average heart rate bumped up by about 6 BPM for that period.
Robert is a Data Scientist on the Research and Development team at Fitbit. His favorite football team is the 49ers.
This information is for educational purposes only and is not intended as a substitute for medical diagnosis or treatment. You should not use this information to diagnose or treat a health problem or condition. Always check with your doctor before changing your diet, altering your sleep habits, taking supplements, or starting a new fitness routine.
If you have questions about a Fitbit tracker, product availability, or the status of your order, contact our Support Team or search the Fitbit Community for answers.
Please note: Comments are moderated and may not appear immediately after submission.