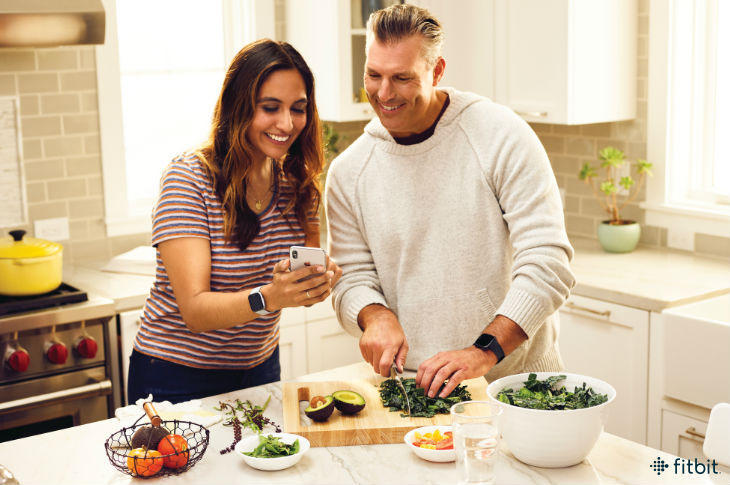
If you’re using the Fitbit app to log your meals, you probably have a good sense of your calorie and macronutrient intake. But many Fitbit users want to track their nutrition numbers beyond just macros. Good news! We listened and the Fitbit food logging feature just got a little bit smarter. In the Fitbit app, you can now see your daily nutrients totals for all the major nutrients including total fat, saturated fat, trans fat, cholesterol, sodium, potassium, total carbs, dietary fiber, total sugars, protein, and your percent daily value for vitamin A, vitamin C, vitamin D, calcium, and iron.
Why Track Nutrients Beyond Macros?
If you have a specific health condition, like high blood pressure for example, your doctor may have advised you to limit your sodium intake and increase your potassium intake. Or perhaps you’re trying to limit how much sugar you’re eating in order to have better blood glucose control while managing your diabetes. If you have heart disease (or are hoping to prevent it), a vital step in lowering your cholesterol is to keep an eye on your saturated fat intake. Trying to lose weight on a lower-calorie diet? Hitting your fiber goal may help keep those hunger pangs at bay! You can now track all these nutrients, and more, in the Fitbit app.
How do I track my nutrients in the Fitbit app?
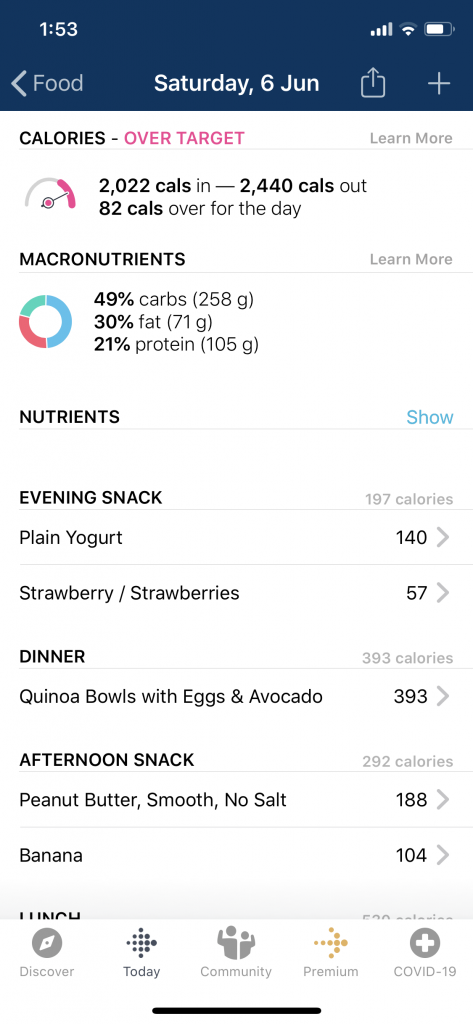
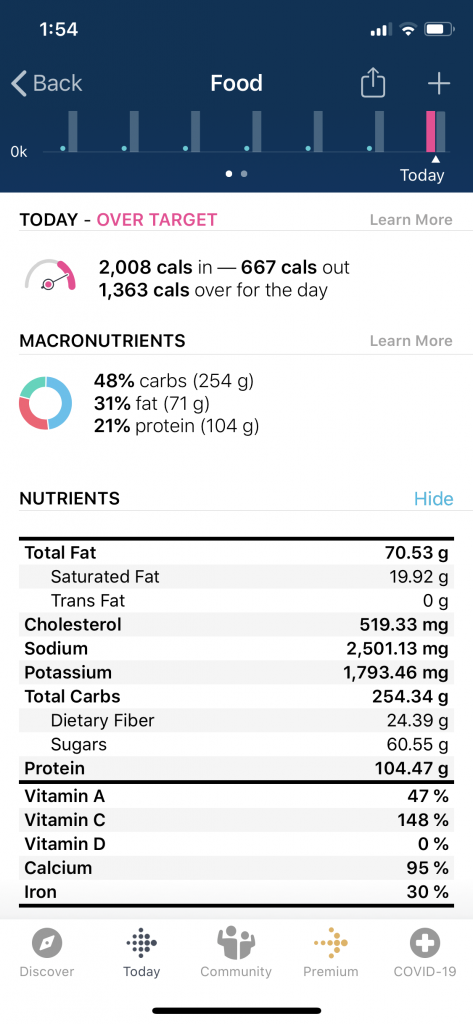
To see your nutrient totals for each day, simply log a few food items in the Food section in the Fitbit app. A new section called “Nutrients” will appear below “Macronutrients” on the summary screen. Tap “Show” to see your daily totals. You can also see your nutrient totals for previously logged days: Tap on the date and then tap “Show” below “Nutrients” and you’ll see your nutrient totals for those days, too.
What Nutrient Targets Should You Aim For Each Day?
Nutrients are compounds in food that are essential to health. The larger compounds, aka macronutrients (carbs, protein, and fat) provide you with energy to move and survive. And the smaller compounds, aka micronutrients (vitamins and minerals) are essential for good health. Your personal nutrient goals, or officially called Dietary Reference Intakes (DRIs), depend on your gender, age, and for women, if you’re pregnant or breastfeeding.
So if you’re wondering what to shoot for each day, here are the DRIs based on age and gender.
| IF YOU’RE AN ADULT BETWEEN 19 AND 50 YEARS… | ||
| Nutrient | Male | Female |
| Total Fat | 20–35% | 20–35% |
| Saturated Fat | <10% | <10% |
| Trans Fat | As low as possible | As low as possible |
| Cholesterol | <300 mg | <300 mg |
| Sodium | <2,300 mg | <2,300 mg |
| Potassium | 4,700 mg | 4,700 mg |
| Total Carbs | 45–65% | 45–65% |
| Dietary Fiber | 38 g | 25 g |
| Total Sugars 1 | <25 % | <25% |
| Protein | 10–35% | 10–35% |
| Vitamin A | 3,000 IU (900 µg RAE) | 2,333 IU (700 µg RAE) |
| Vitamin C | 90 mg | 75 mg |
| Vitamin D | 600 IU (15 µg) | 600 IU (15 µg) |
| Calcium | 1,000 mg | 1,000 mg |
| Iron | 8 mg | 18 mg |
| IF YOU’RE AN ADULT AGED 51 YEARS AND OLDER… | ||
| Nutrient | Male | Female |
| Total Fat | 20–35% | 20–35% |
| Saturated Fat | <10% | <10% |
| Trans Fat | As low as possible | As low as possible |
| Cholesterol | <300 mg | <300 mg |
| Sodium | <2,300 mg | <2,300 mg |
| Potassium | 4,700 mg | 4,700 mg |
| Total Carbs | 45–65% | 45–65% |
| Dietary Fiber | 30 g | 21 g |
| Total Sugars 1 | <25 % | <25% |
| Protein | 10–35% | 10–35% |
| Vitamin A | 3,000 IU (900 µg RAE) | 2,333 IU (700 µg RAE) |
| Vitamin C | 90 mg | 75 mg |
| Vitamin D | 600 IU (15 µg) (51–70 years) 800 IU (20 µg) (70+ years) | 600 IU (15 µg) (51–70 years) 800 IU (20 µg) (70+ years) |
| Calcium | 1,200 mg | 1,200 mg |
| Iron | 8 mg | 8 mg |
| IF YOU’RE PREGNANT OR LACTATING AND 19 YEARS AND OLDER… | ||
| Nutrient | Pregnancy | Lactation |
| Total Fat | 20–35% | 20–35% |
| Saturated Fat | <10% | <10% |
| Trans Fat | As low as possible | As low as possible |
| Cholesterol | <300 mg | <300 mg |
| Sodium | <2,300 mg | <2,300 mg |
| Potassium | 4,700 mg | 5,100 mg |
| Total Carbs | 45–65% | 45–65% |
| Dietary Fiber | 28 g | 29 g |
| Total Sugars 1 | <25% | <25% |
| Protein | 10–35% | 10–35% |
| Vitamin A | 2,566 IU (770 µg RAE) | 4,333 IU (1,300 µg RAE) |
| Vitamin C | 85 mg | 120 mg |
| Vitamin D | 600 IU (15 µg) | 600 IU (15 µg) |
| Calcium | 1,000 mg | 1,000 mg |
| Iron | 27 mg | 9 mg |
1 Total Sugars: There is no Dietary Reference Intake for total sugars, however healthy eating patterns developed by the United States Department of Agriculture (USDA) and the Academy of Nutrition and Dietetics (AND) average 23.3% and 21.1% as total sugars respectively.
Why Are Some Nutrients Shown As Percentages?
To help you understand how each nutrient contributes to your daily needs, food nutrition labels show the % Daily Values for certain nutrients. To keep it simple, the Fitbit app shows the same % Daily Value for vitamin A, vitamin C, vitamin D, calcium, and iron. These values are based on a 2,000-calorie diet, so may not be the exact right number for you (those are listed in the tables above), but rather a quick-and-easy snapshot of how close you’re coming to hitting the average nutrient requirement.
Here are the Daily Value amounts used to calculate your percentages in the Fitbit app.
| Nutrient | Daily Value |
| Vitamin A | 5,000 IU |
| Vitamin C | 60 mg |
| Vitamin D | 400 IU |
| Calcium | 1,000 mg |
| Iron | 18 mg |
This information is for educational purposes only and is not intended as a substitute for medical diagnosis or treatment. You should not use this information to diagnose or treat a health problem or condition. Always check with your doctor before changing your diet, altering your sleep habits, taking supplements, or starting a new fitness routine.
Tracy Morris

Tracy Morris is Fitbit’s Lead Nutritionist. With a master’s degree in nutrition and dietetics from South Africa, she’s also an Australian Accredited Practising Dietitian, and an international member of the Academy of Nutrition and Dietetics in the US. Over the past 20 years, Tracy's lived in five different countries, inspiring people around the globe to be healthy. She currently lives in sunny Sydney, Australia where she helps Fitbit fans around the globe live their best lives. When she’s not working, running after her three young kids, or practicing pilates, she can be found sipping pinot noir with her husband watching the sun set.
If you have questions about a Fitbit tracker, product availability, or the status of your order, contact our Support Team or search the Fitbit Community for answers.
Please note: Comments are moderated and may not appear immediately after submission.